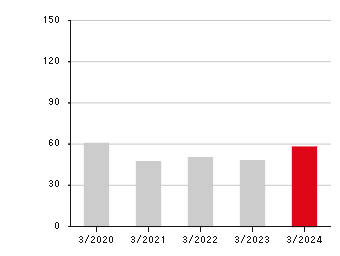
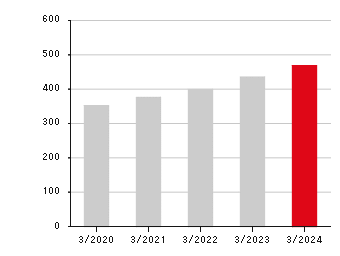
Key Management Indicators(Per share indicators)
Per share indicator
(Unit: Yen)
| FY 3/2022 | FY 3/2023 | FY 3/2024 | FY 3/2025 | FY 3/2026 | |
|---|---|---|---|---|---|
| Net income per share | 49.94 | 47.71 | 57.85 | 58.92 | 56.47 |
| Net assets per share | 399.01 | 435.20 | 467.99 | 509.04 | 554.83 |
※Net income per share = Current profit/ Average number of shares during the current fiscal year
※Net assets per share = Net assets / Number of outstanding shares